Shaving 35% Off a React Bundle: A Field Guide
The practical, measured steps that took a bloated production React app from sluggish to snappy — code splitting, lazy loading, dependency audits, and the profiler habits behind a 25% faster load.
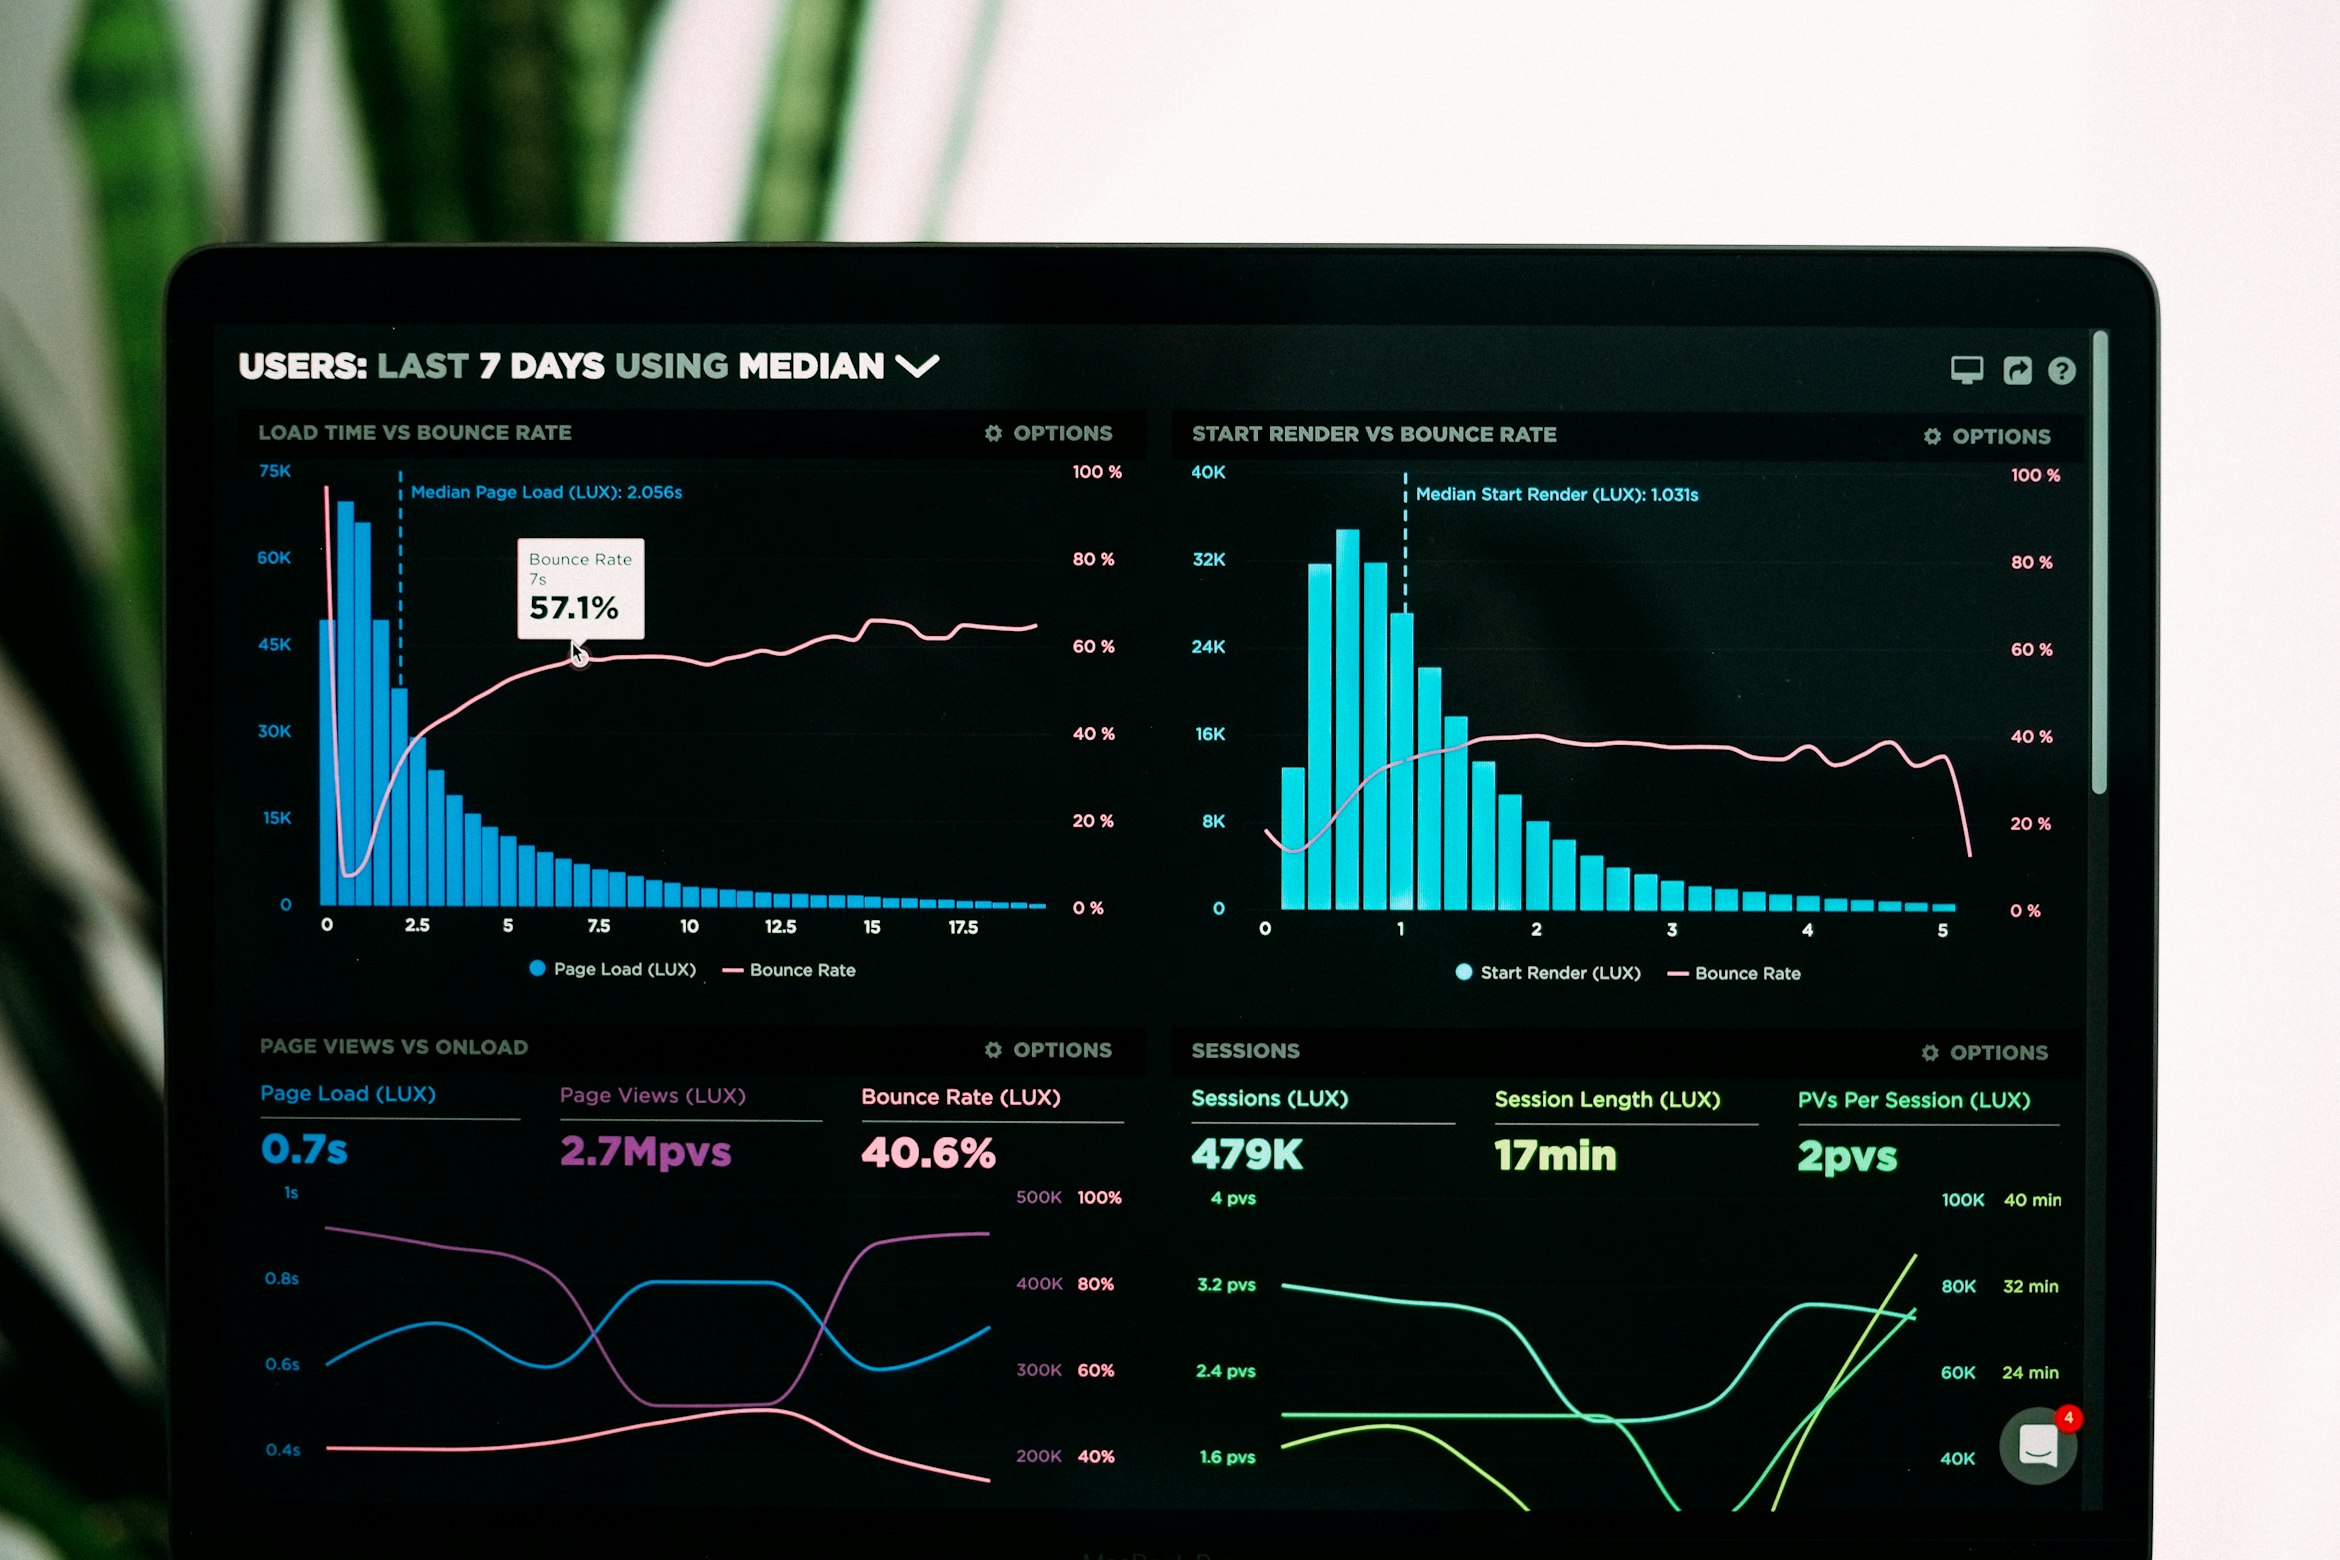
The short answer: To cut a bloated React bundle, measure first with a bundle visualizer, then go after the biggest structural wins — auditing heavy dependencies and route-level code splitting — before touching any micro-optimizations. That order is how I took a real app down ~35% in bundle size and ~25% in load time, and almost none of it was where I first guessed.
Performance work goes wrong when it starts with intuition instead of measurement. "The app feels slow, let me add some useMemo" is how you spend a week and move nothing. On one of our platform apps I cut the main bundle by roughly 35% and the median load time by about 25% — and almost none of it came from where I first guessed. Here's the process that actually worked.
Measure first, with the right tool
Before touching a line, visualize what's in the bundle. source-map-explorer or the webpack/Vite analyzer plugin turns the bundle into a treemap. The surprises live here: a date library pulling in every locale, a charting dependency imported for one sparkline, two different utility libraries doing the same job because two teams each added one.
My single biggest win was a 70KB (gzipped) moment.js that we used for exactly two format calls. Swapping it for date-fns with per-function imports — or native Intl.DateTimeFormat where possible — erased it. Audit dependencies before you optimize code; a wrong dependency outweighs a hundred micro-optimizations.
Code-split at the route level
The home page should not ship the admin dashboard's code. Route-based React.lazy + Suspense means each route's JS loads on demand. This alone is usually the largest structural win.
Lazy-load heavy libraries, not just routes
Some dependencies are heavy enough to split even within a page. A rich-text editor, a charting library, a PDF viewer — load them when the feature is actually used, behind an interaction or an in-view trigger, so they never touch the initial load.
Then — and only then — reach for memoization
Once the bundle is lean, the React Profiler shows you the runtime cost: components re-rendering on every keystroke, expensive lists without stable keys, context providers whose value is a fresh object every render. useMemo, useCallback, and React.memo are precise instruments for the hotspots the profiler flags — not seasoning to sprinkle everywhere. Applied blindly they add overhead and noise; applied to a measured hot path they're transformative.
Keep it honest with a budget
The gains erode the moment someone adds the next convenient dependency. A bundle-size check in CI (size-limit or the bundler's built-in budget) that fails the build when the main chunk crosses a threshold turns performance from a one-time project into a standing guarantee. Measure, cut the structural fat, split what's heavy, profile the runtime, and lock the win in with a budget. In that order.


